Glove / Field study No. 05
A South Carolina commercial property is taxed on what it was worth the last time it sold.
South Carolina resets a property’s taxable value when it changes hands, so the gap between what a commercial property is worth and what it is taxed on is a function of how long the owner has held it. We counted all three Charleston tri-county parcel records — 395,283 parcels across three unrelated CAMA systems. In Berkeley County, commercial property last sold before 2012 is taxed on a value 44.3% below the county’s own market figure; property sold since 2022 is taxed on the full amount. Dorchester, on a different vendor, produces the same gradient. Charleston County, the largest of the three, cannot show it at all.
Share or cite:LinkedInXCite, link or embed ↓
Key takeaways
Fourteen figures, each one complete on its own. Every number is printed by count_charleston.py and published in the counts CSV, except where the note under a takeaway says otherwise.
- Berkeley County commercial property last sold before 2012 is taxed on a value 44.3% below the county’s own market figure; property sold since 2022 is taxed on the full amount — a median gap of 44.3% against 0.0%, falling monotonically through every band in between.Berkeley County parcel service, 3,357 parcels with a commercial building and both values, counted 20 Sep 2026.
- The same gradient reproduces in Dorchester County on an unrelated CAMA system — 54.7% below market for the 6% class last sold before 2012, 0.0% for property sold since 2022, across 26,182 parcels.Dorchester County parcel service, layer
Parcel_CAMA_06282024, counted 20 Sep 2026. - 92.2% of Berkeley commercial property held since before 2012 is taxed below its market value, against 44.7% of property sold since 2022.Berkeley County parcel service, counted 20 Sep 2026.
- Only 7.0% of Berkeley commercial property sold since 2022 shows South Carolina’s 25% commercial transfer exemption in its taxable value — 52 of 742 parcels. 54.9% are taxed on the full market value with no exemption visible at all. The exemption is opt-in and lapses if the buyer does not notify the assessor by 31 January.Berkeley County parcel service, counted 20 Sep 2026, against S.C. Code Ann. §12-37-3135.
- The event that resets a South Carolina property’s value is not recorded in the record — Berkeley’s
TMACode, the only field in the metro resembling an assessable-transfer flag, is populated on 182 of 123,050 rows, 0.1%.Berkeley County parcel service, counted 20 Sep 2026. - Charleston County publishes an appraised value on 186,794 parcels and a taxable value on none of them — there is no assessed or taxable column anywhere in the layer’s 47 fields, so the largest county in the metro cannot show this effect at all.Charleston County parcel service, 197,620 parcels, counted 20 Sep 2026.
- One housing market, three county records, three CAMA vendors and no shared schema — 197,620 parcels in Charleston, 123,050 in Berkeley, 74,613 in Dorchester, 395,283 in total, with no field in common that answers the same question.All three county parcel services, counted 20 Sep 2026.
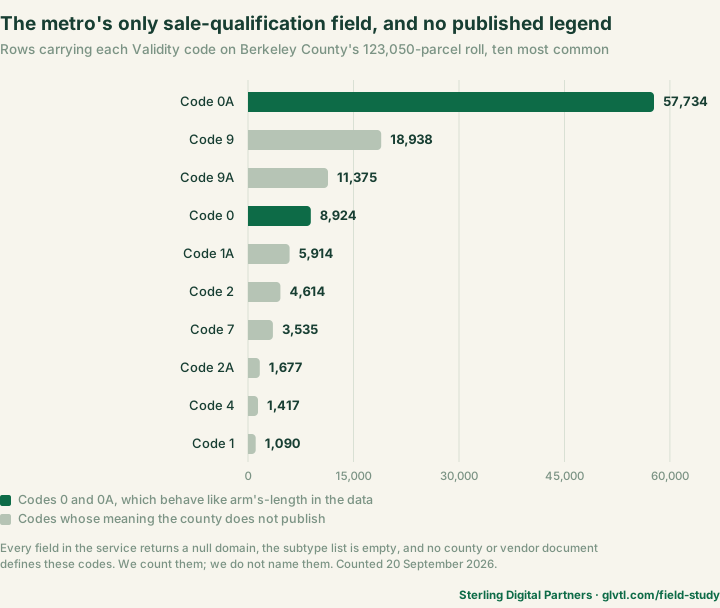
- The only sale-qualification field in the Charleston metro carries 24 distinct codes and no county, vendor or state document defines any of them.Berkeley County
Validityfield; every field in the service returns a null domain. Searched 20 Sep 2026; see the method note. - 51.5% of Berkeley’s commercial sales in 2024 and 2025 carry a qualification code other than the two that behave like arm’s-length — 193 of 375.Berkeley County parcel service, counted 20 Sep 2026.
- 28.2% of Charleston County’s commercial property transfers in 2024 and 2025 were recorded at $100 or less — 373 of 1,324, and 163 of them at exactly $0.Charleston County parcel service, our published class-code list, counted 20 Sep 2026.
- Charleston County’s parcel service returns 57 rows that do not exist — paging it returns 197,677 records against an advertised count of 197,620, with duplicate identifiers, and setting a stable sort order does not prevent it.Charleston County parcel service, counted 20 Sep 2026. Berkeley and Dorchester page exactly.
- 35,838 Charleston County parcels are addressed MOUNT PLEASANT and another 6,411 are addressed MT PLEASANT — one town, two spellings, in one column. Counting it by name undercounts the town by 15%.Charleston County parcel service, counted 20 Sep 2026.
- 63,820 Charleston County parcels carry a Charleston property address and they sit in 21 different tax districts.Charleston County parcel service, counted 20 Sep 2026.
- Berkeley County’s cadastral API describes itself as “API for Animal Control.”
serviceDescriptionand ISO metadata read at the county’s ArcGIS server on 20 Sep 2026; not produced by this study’s script.
Finding 01 / The reset
What a commercial property is taxed on depends on the year it last changed hands.
Why does a South Carolina property’s taxable value depend on when it sold?
Because the state rebuilt its property tax around the sale. Under the South Carolina Real Property Valuation Reform Act — Act 388 of 2006, effective on ratification in April 2007 — a property’s fair market value for tax purposes is fixed at the later of the 2007 base year, the 31 December following an assessable transfer of interest, an appeal, or a countywide reassessment. That is §12-37-3140(A)(1).
The clause that creates the gradient is the next one. §12-37-3140(B) limits any increase produced by a countywide reassessment to 15% over a five-year cycle — and then exempts sales from that limit in its own final sentence: the cap does not apply “to the fair market value of real property when an assessable transfer of interest occurred in the year that the transfer value is first subject to tax.” Reassessment creeps upward at a capped rate. A sale jumps straight to the full number. Hold a building long enough and the two diverge by as much as the market has moved.
So this is not a story about assessors being wrong. Both values on these rows are the county’s own, both are correct, and the distance between them is what the statute instructs. The question worth asking is how large that distance has become, and nobody appears to have counted it.
How far below market is a long-held commercial property taxed in the Charleston metro?
In Berkeley County, a median of 44.3% for commercial property last sold before 2012. We took every Berkeley parcel carrying a commercial building and both a taxable and a market value — 3,357 parcels — and measured each one’s taxable value against the sum of its own building and land market values. Sorted by the year the property last changed hands, the result falls in a straight line:
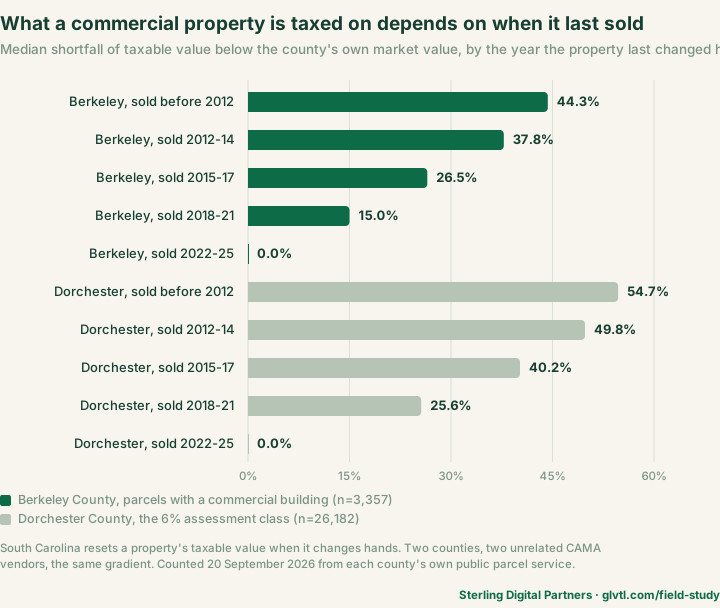
Dorchester County reproduces it. Different county, different vendor, a static 2024 extract rather than a live service, and a different method of getting at the same quantity — Dorchester publishes an assessed value rather than a taxable one, so we divide by the statutory 6% ratio to recover what the county is taxing. Across 26,182 parcels in the 6% class the medians run 54.7%, 49.8%, 40.2%, 25.6% and 0.0% over the same five bands. That two independent records produce the same monotonic shape is the reason to believe either of them.
A commercial building in Berkeley County that has not sold since 2011 is, at the median, taxed on 56 cents of every dollar it is worth. The building next door that sold in 2023 is taxed on all of it.
Is it just that a few old parcels are badly valued?
No — it is most of them. The median hides how broad this is, so we counted the share of parcels showing any shortfall at all. Among Berkeley commercial property held since before 2012, 92.2% is taxed below its market value. Among property sold since 2022, 44.7% is. Dorchester runs 86.0% down to 30.4%.
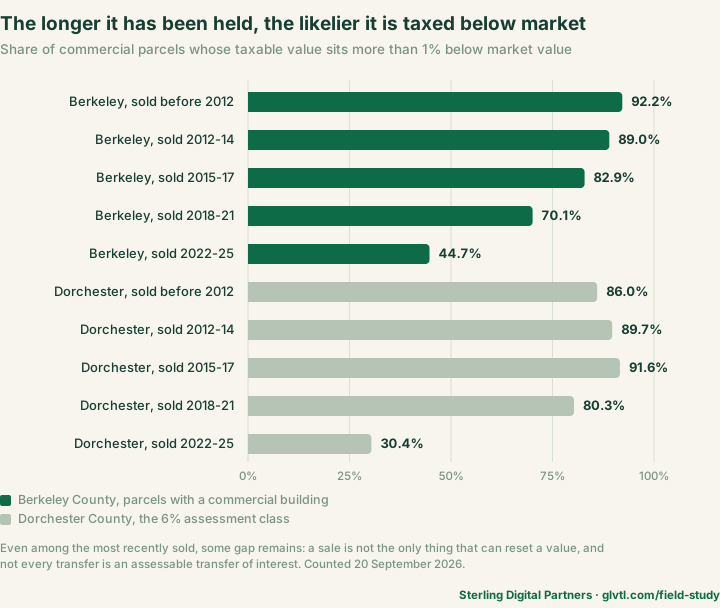
Note what the last band does not say. 44.7% of recently sold Berkeley commercial property still carries some gap, and that is expected: §12-37-3150(B) excludes fifteen categories of transfer from counting as an assessable transfer of interest — foreclosures before redemption expires, transfers between commonly controlled entities, corporate reorganisations under IRC §§351, 355, 368 and 721, fractional interests of 50% or less, and others. A recorded deed is not the same thing as a reset. Any analysis that equates the two will be wrong, and this study does not.
A worked example: two large industrial buildings in the same county. Berkeley TMS 1570000033, at 2274 Volvo Car Dr in Ridgeville, is 1,127,168 sq ft on 110.65 acres. It sold on 29 October 2024 for $121,000,000, carries qualification code 0A, and the county records a market value of $122,927,300 and a taxable value of $122,927,300. The two are identical. That is the reset working exactly as the statute describes it.
Berkeley TMS 2110002071, at 728 Reboot Rd, is 1,521,302 sq ft on 387.64 acres — larger on both measures. The record shows it last changing hands on 15 December 2006, at a stated price of $1, under qualification code 1. Its market value is $46,986,400. Its taxable value is $4,101,769. The county is taxing it on 8.7% of what the county says it is worth, a shortfall of 91.3%.
What this pair does and does not show. It is a real illustration of the mechanism and both sets of figures are the county’s own. It is not a like-for-like comparison of two similar assets: a stated price of $1 under a non-arm’s-length code usually signals a transfer between related parties, the two sites differ in age, condition and use, and 728 Reboot Rd’s market value per square foot is low enough that its own valuation may be the older figure. It is one parcel, chosen because it is legible. The 44.3% median in the chart above, not this parcel, is the finding.
All figures for both parcels read from the Berkeley County parcel service on 20 September 2026: O_TMS, GIS_Address, CommBuildingSQFT, TotalAcres, SaleDate, SalePrice, Validity, TotalTaxValue, BuildingMarket and LandMarket. Berkeley County’s own website returns HTTP 403 to automated requests, so these were not cross-checked against its public record card.
Check it yourself
The comparison is two columns, and the trap is knowing which pair. In Berkeley, TotalTaxValue is the taxable value and it equals the sum of the capped component values, while BuildingMarket plus LandMarket is the uncapped market figure. In Dorchester there is no taxable column at all: AssdVal is an assessed value, already multiplied by the statutory ratio, so it must be divided by 0.06 before it can be compared to ActVal_Mkt. Compare an assessed value to a market value directly and every parcel in the county looks like it is taxed at a 94% discount.
Get the ratio from the statute, not from the data. §12-43-220(e) sets 6% for “all other real property”, which is the commercial catch-all, and (c)(1) sets 4% for an owner-occupied legal residence. Subsection (f) is personal property at 10.5% and is not the commercial ratio, though it is easy to cite by mistake. We assign the ratio from each county’s own legal-residence flag and then check our work: 324 parcels, 1.2% of the Dorchester 6% class, come back with an implied ratio above 6%, which means our class assignment or the county’s market value is wrong on those. We publish the number rather than dropping them.
Finding 02 / The exemption
South Carolina offers commercial buyers a quarter off. Almost nobody appears to be taking it.
What is the ATI fair market value exemption?
When 6%-class property — commercial property, in practice — undergoes an assessable transfer of interest, §12-37-3135 allows the new owner an exemption of 25% of the transfer value. It has applied to transfers since 2010. It is, on its face, one of the largest discretionary reliefs available to a commercial buyer in the state: on a $10m purchase it removes $2.5m from the taxable base every year the owner holds the property.
It is also opt-in, and the condition is a single sentence. §12-37-3135(C): the exemption “does not apply unless the owner of the property, or the owner’s agent, notifies the county assessor that the property will be subject to the six percent assessment ratio… before January thirty-first for the tax year for which the owner first claims eligibility.” One notification, once, and it persists for as long as the property stays in the 6% class. Miss it and the year is gone.
How many commercial buyers actually hold it?
On the Berkeley record, 7.0%. If a buyer holds the exemption, the taxable value should sit about a quarter below the market value, so we counted where recently sold commercial parcels land. Of the 742 Berkeley commercial parcels last sold between 2022 and 2025, 52 — 7.0% — sit in the 24.5% to 25.5% band. 407 of them, 54.9%, are taxed on the full market value with no exemption visible at all. The rest are scattered between.
This is a count of an effect, not of applications filed. We cannot see the assessor’s inbox, and there are honest reasons a parcel might show no exemption: the transfer may not have been an assessable one under the fifteen exclusions in §12-37-3150(B); the statute’s own floor at §12-37-3135(B)(2)(a) provides that no exemption value “may be less than current fair market value of the parcel,” so where a sale landed close to the existing value the exemption yields nothing; and (B)(2)(b) switches it off entirely where the transfer value came in below the current one. What the record supports is the narrow claim, and it is quotable on its own: fewer than one in fourteen recently sold Berkeley commercial parcels is taxed as though the 25% exemption applies to it.
If you bought commercial property in South Carolina last year and nobody told you about §12-37-3135, the deadline to claim it for this tax year is 31 January, and the record suggests you are in the majority.
Does the record show which sales triggered a reset?
No. The event that drives the entire South Carolina property tax is not a field in any of the three records. There is no ATI column, no ATI date and no ATI value in Charleston’s 47 fields, Berkeley’s 114 or Dorchester’s 44. The closest thing in the metro is Berkeley’s TMACode, and it is populated on 182 of 123,050 rows — 0.1%.
So the reset is visible only as an inference: a value that moved, next to a date that explains it. Every figure on this page is derived that way, and the method section says so plainly. A record that governs a tax base this large without recording its own triggering event is, itself, the finding.
Finding 03 / Three records
One housing market, three county records, and no two of them answer the same question.
Can the Charleston tri-county market be analysed as one market?
Not from the records. The three counties do not publish the same facts. Charleston, Berkeley and Dorchester share a labour market, a port, a housing market and a set of brokers. They share nothing whatsoever about how they describe a parcel. We pulled all three in full — 197,620 parcels in Charleston, 123,050 in Berkeley, 74,613 in Dorchester — and no single finding on this page can be produced in all three.
| Question | Charleston | Berkeley | Dorchester |
|---|---|---|---|
| Parcels published | 197,620 | 123,050 | 74,613 |
| Market value | Yes, 186,794 parcels | Yes | Yes |
| Taxable or assessed value | No such field | Yes, taxable | Yes, assessed |
| Sale qualification code | No | Yes, 24 codes, undocumented | No |
| Property address distinct from tax district | Yes, a true situs city | No, the city column is the owner’s mailing city | Property location only |
| Dated, static extract | No, effectively live | No, but every row is stamped | Yes, a 2024 vintage |
| Distinct tax districts | 44 | 21 | 15 |
| Last countywide reassessment | 2025 | 2024 | 2024, inferred |
| Published terms of use | Yes, and restrictive | None; data is sold | None on this layer |
Why can’t Charleston County show the reset?
Because it does not publish a taxable value. Charleston’s parcel layer carries LAND_APPR, IMP_APPR and APPRAISAL, and the third is simply the sum of the first two. All three are market figures. 186,794 parcels carry an appraised value and none carries a taxable or assessed one, because no such column exists among the layer’s 47 fields.
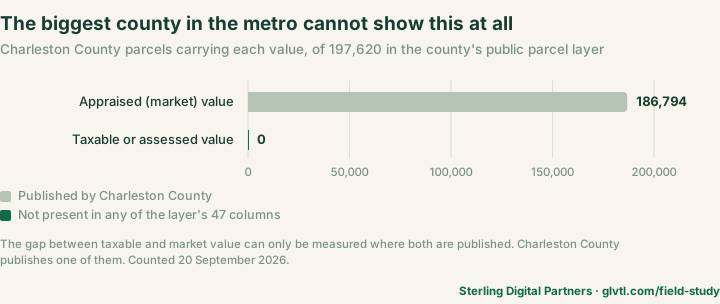
This is the part worth carrying away. The county with the most parcels, the best-documented GIS operation and the only true situs-city column in the metro is the one county where the largest effect in South Carolina property tax is invisible. Had we scouted Charleston County alone — the obvious front door, and the one the market is named after — we would have concluded the finding did not exist.
Finding 04 / The legend
The metro’s only sale-qualification field has 24 codes and no published legend.
Which Charleston-area sales were arm’s length?
Only Berkeley County offers an answer, and it will not say what the answer means. Its Validity field is the single sale-qualification column anywhere in the tri-county record. It carries 24 distinct codes — 0, 0A, 0AC, 1 through 9, each with an A variant, plus 6AC, 8AC and 9AC — over 117,378 rows, with a further 5,672 rows carrying none. Of Berkeley’s 375 commercial parcels sold in 2024 or 2025, 193 — 51.5% — carry something other than 0 or 0A, the two codes that behave in the data like ordinary sales.
Is there a published legend for these codes anywhere?
We could not find one, and we looked hard enough to say where the absence starts. Every field in the service returns a null domain and the subtype list is empty. The service’s own metadata is blank. The county publishes no data dictionary, no open-data catalogue and no assessor document containing a code list; its all-forms index has nothing matching. South Carolina prescribes no statewide set: §12-43-250 requires the Department of Revenue to conduct sales ratio studies but specifies no codes, and the Department publishes no sales ratio study manual. The CAMA vendor is Patriot Properties, now part of Catalis, which publishes no manual either — and a Patriot record-card guide written for another jurisdiction states plainly that sale validity codes are a “town generated field,” which explains why no vendor legend exists to find.
Compare Massachusetts, where the state Department of Revenue publishes a non-arm’s-length code list and every assessor uses it. South Carolina has no equivalent. That is not a criticism of Berkeley County, which is publishing more than either of its neighbours; it is the reason a number derived from these codes cannot be checked by the person reading it.
What we are not doing is guessing. There is a Massachusetts code set with a superficially similar shape, and it uses letters A through X rather than digits with A and AC suffixes. It does not map, and we have not mapped it. This page counts the codes and names none of them. We have asked Berkeley County Real Property Services for the legend; if it arrives, this section gets rewritten and the page re-dated.
A sale-qualification code you cannot decode is not a qualification. It is a reason to open the deed.
Finding 05 / The price
More than a quarter of Charleston’s commercial transfers were recorded at $100 or less.
What did Charleston County commercial property sell for last year?
For 373 of the 1,324 transfers recorded in 2024 and 2025, the record says $100 or less. That is 28.2% of them; 163, or 12.3%, say exactly $0. South Carolina is a disclosure state and Charleston County does publish a sale price, which puts it ahead of every Texas county in study No. 04. What it publishes on better than a quarter of commercial transfers is a nominal consideration.
These are not errors. A $10 or $0 deed is how a transfer into an LLC, a correction, a family conveyance, a foreclosure or an entity reorganisation is ordinarily recorded, and — per §12-37-3150(B) — many of those are precisely the transfers that do not reset value. The point is operational rather than statistical: a commercial comparable set built from Charleston’s recorded prices without filtering these out will be built on a quarter noise, and Charleston, unlike Berkeley, ships no code to filter on.
Our commercial figure here depends on a class-code list we chose — sixteen of Charleston’s 44 codes, covering 12,607 parcels. The list is printed in full at the top of count_charleston.py so anyone can disagree with it precisely.
Finding 06 / The record itself
Five columns in these records mislead on their names alone, and one service invents rows.
Can you trust a parcel count taken straight from these services?
Not from Charleston’s without checking it. Paging the Charleston County parcel service returns 197,677 rows against an advertised count of 197,620. Fifty-seven of them are duplicates of rows already returned. We had expected this — it is a known failure mode when a service pages without a stable sort — so we set an explicit sort order on the object identifier before pulling. It made no difference. The duplicates still came. De-duplicating on the identifier returns exactly 197,620, which is how we know the advertised count is the right one.
Berkeley and Dorchester paged exactly, first time, no duplicates. So this is a property of one service, not of the technology, and there is no way to discover it except to reconcile every extract against the service’s own count. Our script does that on all three and refuses to print a figure if any of them disagrees.
Which columns in these records are not what they are called?
Charleston’s PROP_TYPE is not a property type. It holds the street suffix — DR, RD, ST, AVE. Anyone reaching for the obviously named column to classify property gets 43,981 parcels of “Drive.”
Charleston’s class code splits when you group on its label. The column combines the code and its description in one string, and code 730 appears as both 730 - Golf Course (51 parcels) and 730 - GOLF COURSE (42). Grouping on the text yields 45 classes; grouping on the three-digit code yields the correct 44. One letter case, one phantom category, 42 parcels in the wrong bucket.
The same column spells one town two ways. 35,838 Charleston parcels carry the property city MOUNT PLEASANT and another 6,411 carry MT PLEASANT. They are the same town. Count it by name and you undercount South Carolina’s fourth-largest municipality by 15%.
Dorchester’s legal-residence flag holds YES and NO, not Y and N. A filter written the obvious way returns zero rows and no error, which is the worst way for a query to fail. Its SALE_PRICE is typed as text rather than a number, and one row in the county holds the value -4: a sale recorded at minus four dollars, in December 1995.
And Berkeley’s city column is not a situs city. It is the owner’s mailing city, with 2,931 distinct values. Only Charleston publishes where the property actually is — which is how we can say that its 63,820 parcels addressed CHARLESTON sit in 21 different tax districts. A Charleston address tells you very little about what a property pays.
Every one of these costs an afternoon, once, to the person who finds it. None of them is documented anywhere. That is the whole reason this series exists.
Check it yourself
Before you read a single value out of a county service, ask it three questions. How many rows do you claim to have? — returnCountOnly=true, and reconcile your extract against it every time. What are your fields actually called and typed? — the layer’s own ?f=json, read before you write a filter, not after it returns nothing. And what does this column contain, as opposed to what is it named? — pull the distinct values, all of them, and read them. Each of the five problems above surfaces in under a minute that way, and none of them surfaces at all if you trust the column name.
One last caution about metadata. Berkeley’s cadastral service — the source of most of this page — describes itself in its own serviceDescription and ISO metadata as “API for Animal Control.” Its only layer is VECTOR.DATA.PARCELS_PATRIOT, with every parcel, value, sale and validity field on it. Read the layer, not the label; we nearly discarded the best record in the metro on the strength of its description.
When you do this weekly
Two values, not one, and the date that explains the distance between them.
Every check on this page is doable by hand, and all three counties publish enough to do it. But in South Carolina a single value is never the answer: you need the market figure, the taxable figure, and the date the property last changed hands, because the third is what makes the first two disagree. Three counties, three schemas, three sets of column names that mean different things.
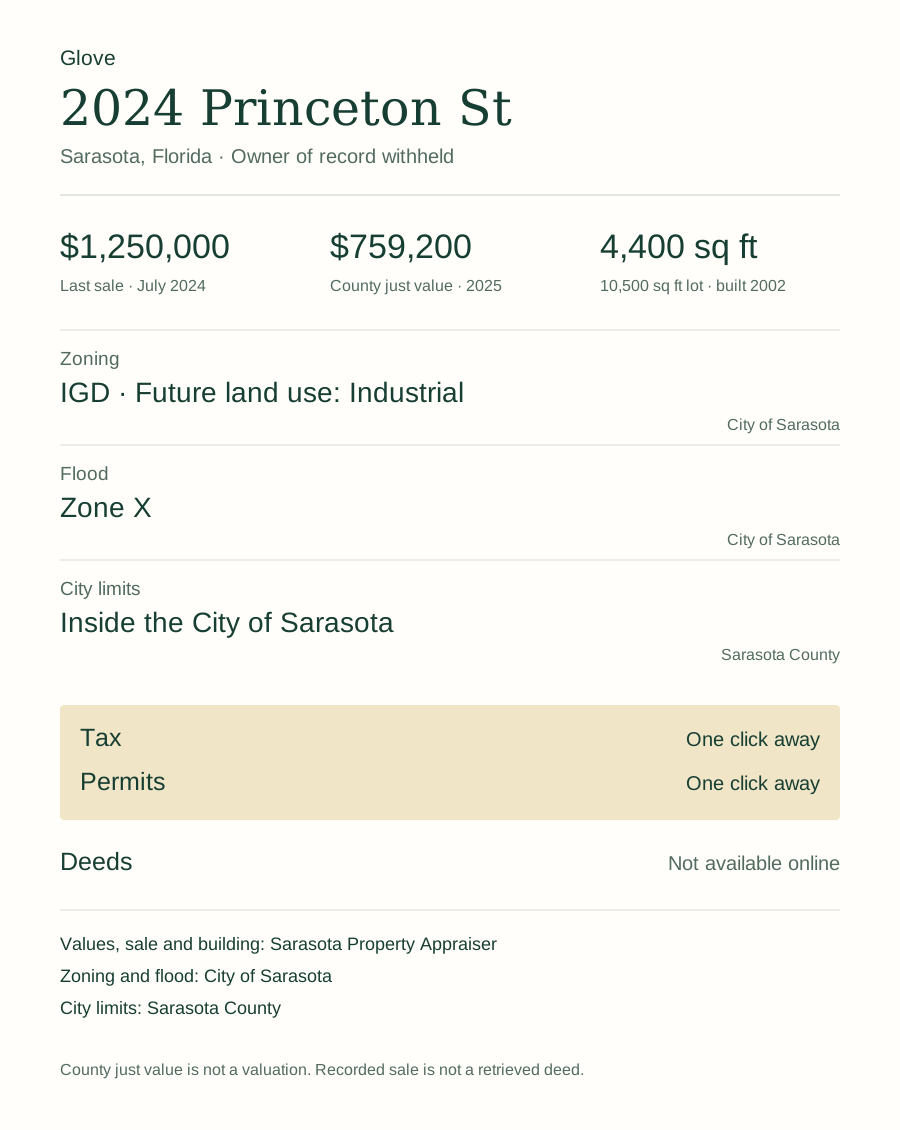
Glove does the same digging in one call, inside Claude Code, Cursor or Codex — parcel, the value type the county reports with its year, last sale, zoning, flood and city limits, each number carrying the page it came from. Recorded documents and permits are still yours to click.
Five free packets. Each successful packet uses one credit.
Works in Claude Code, Cursor and Codex.
Method, and what these counts do not establish
Source
Three public ArcGIS REST services, read on 20 September 2026. No key, no login, no fee, no request form. Charleston County: gisccapps.charlestoncounty.org/arcgis/rest/services/ProVal/ParcelMap/MapServer/0, 197,620 parcels. Berkeley County: gis.berkeleycountysc.gov/arcgis/rest/services/API/CAD_API/MapServer/0, 123,050 parcels, layer VECTOR.DATA.PARCELS_PATRIOT. Dorchester County: services.arcgis.com/ehmkfEMN55hUsomR/ArcGIS/rest/services/Parcels/FeatureServer/0, 74,613 parcels, layer Parcel_CAMA_06282024.
Every extract is reconciled against the service’s own returnCountOnly before any figure is computed, and count_charleston.py exits rather than print a number if a reconciliation fails.
Dates, and what each source is a snapshot of
Only Dorchester is a static, dated extract: its layer is named for 28 June 2024, its service describes itself as “Parcels for 2024” and its last edit dates are in August 2024. Dorchester figures on this page are a 2024 vintage and should be quoted as such. Berkeley is live but stamps every row with a generation date; the rows we read were generated 14 September 2026. Charleston is effectively live and carries no in-row date at all, so a Charleston figure here is a reading taken on 20 September 2026 and nothing more. None of the three publishes an archived historical snapshot, so none of these counts can be reproduced for a past date by anyone, including us. That is why the counts CSV is published beside the script.
Definitions
The gap. For Berkeley, one minus TotalTaxValue divided by the sum of BuildingMarket and LandMarket. For Dorchester, one minus AssdVal divided by 0.06, divided by ActVal_Mkt — the division by the statutory ratio converts an assessed value into the taxable value it implies. Both are the county’s own figures on the county’s own row; we compute no valuation of our own anywhere on this page.
Commercial. Three different definitions, because the three records support three different things, and each is stated wherever it is used. Berkeley: CommBuildingCount greater than zero, 3,506 parcels, of which 3,357 carry both values. Dorchester: the 6% assessment class, derived from the legal-residence and agricultural-use flags, 26,182 parcels — this is broader than commercial and includes rental and second-home residential, and the page says “6% class” rather than “commercial” wherever it is meant. Charleston: sixteen class codes listed in full at the top of the script, 12,607 parcels. These three populations are not comparable to one another and no figure on this page adds them together.
Assessment ratio. Assigned from statute, not inferred from the data: §12-43-220(e), 6% for all other real property; (c)(1), 4% for an owner-occupied legal residence. On 324 Dorchester parcels — 1.2% of that class — the implied ratio comes back above 6%, meaning our class assignment or the county’s own market value is wrong on those rows. They are counted, reported and left in.
What this is not
It is not a claim that anyone is underpaying. Every figure here describes the statute operating as written. §12-37-3140(B) caps reassessment increases and exempts sales from that cap; a long-held property taxed below market is the intended result of that design, not an error or an avoidance.
It is not a count of assessable transfers of interest. No record in the metro publishes one. We measure the effect and infer the cause, and §12-37-3150(B)’s fifteen exclusions mean a recorded deed and a reset are different events. Anyone counting deeds as resets will get a larger number than this page reports, and it will be wrong.
It is not a count of exemption applications. Finding 02 counts parcels whose taxable value sits in the band the 25% exemption would produce. It cannot see filings, and the statute’s floor and exclusions give honest reasons a parcel might show no exemption without its owner having missed anything.
It does not cover the whole metro. The Charleston metropolitan area as the Census defines it is these three counties, and all three are here — but the headline gradient rests on Berkeley and Dorchester only, because Charleston County does not publish the second value it would require.
Terms, and what we did not republish
Charleston County attaches terms of use to its GIS data which state that a user “may not publish, in the public domain, DATA in any form without written approval of the County,” and which require derived output to carry a county copyright notice and the date of the data. Nothing on this page or in the counts CSV republishes Charleston County parcel records. What we publish are aggregate counts computed from them — totals, shares and distinct-value counts — and no parcel-level Charleston data of any kind. Charleston County figures here are derived from data © County of Charleston, South Carolina, read 20 September 2026. Berkeley County publishes no terms and sells parcel data commercially; Dorchester County attaches no licence to this layer. If Charleston County reads the terms differently than we do, tell us and we will take the Charleston figures down.
Outstanding, and stated rather than hidden
Two things on this page are unresolved and we would rather say so than round them off. Berkeley’s Validity legend has been requested from Real Property Services; until it arrives, finding 04 counts codes it cannot name. Dorchester’s 2024 reassessment year is an inference, not a county statement: the assessor mailed assessment notices countywide in August 2019 and ran a public “Reassessment Roadshow” in July 2024, which with the five-year cycle in §12-43-217 puts implementation in 2024. Charleston’s 2025 and Berkeley’s 2024 are stated by those counties directly.
Reproduce it
Download count_charleston.py and run it. Standard library only, no dependencies, no key. It pulls all three counties, reconciles each against its advertised count, prints all 99 figures and writes the CSV published beside it. make-charts.py draws the four charts on this page, and reads every plotted value from that CSV rather than from anything typed in by hand — if a number is not in the CSV it raises instead of drawing it.
Cite this study
Klebl, Chris. “A South Carolina commercial property is taxed on what it was worth the last time it sold.” Sterling Digital Partners, field study No. 05, 20 September 2026. https://glvtl.com/field-study/charleston-commercial-record/
Link to a finding
<a href="https://glvtl.com/field-study/charleston-commercial-record/#f1">Berkeley County commercial property last sold before 2012 is taxed on a value 44.3% below the county's own market figure</a>
The four charts are free to embed; each carries its own snippet above. The counts CSV and both scripts are published under CC BY 4.0 — reuse them anywhere with a link back.
Corrections
If a count looks wrong, tell us with the metric name and the public source. We will re-run it and re-date the page.
Looking up a Charleston, Berkeley or Dorchester County record yourself? The Charleston records directory lists every official source we have checked there, with the date a person opened it and what trips people up.
The series
This is the fifth of ten, and the first in South Carolina. Study No. 01 counts Sarasota and Manatee; study No. 02 counts Miami-Dade; study No. 03 counts Mecklenburg County, North Carolina, where there is no assessment cap of any kind; study No. 04 counts Harris County, Texas, where there is no published sale price at all. Read against those, this one is the control: South Carolina resets on transfer, Florida limits annual growth, North Carolina does neither. The rest are listed on the field studies index, where you can ask to be told when your market lands.