Glove / Field study No. 04
A third of Houston’s commercial property is taxed by no city.
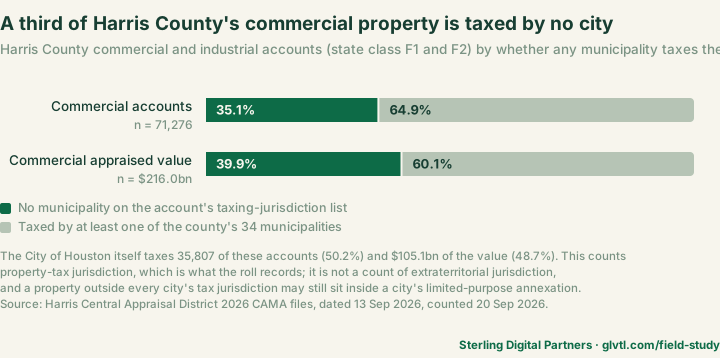
We counted the Harris Central Appraisal District’s 2026 roll — 1,628,306 accounts, 71,276 of them commercial or industrial — by the taxing jurisdictions each account actually pays. 25,031 of them pay no city at all. Texas records no sale price, so where the earlier studies in this series read prices, this one reads jurisdiction: who taxes a property, how many of them there are, and what the record still will not tell you afterwards.
Share or cite:LinkedInXCite, link or embed ↓
Key takeaways
Thirteen figures, each one complete on its own. Every number is printed by count_harris.py and published in the counts CSV, except the two marked otherwise.
- 35.1% of Harris County, Texas commercial property lies outside every city’s property-tax jurisdiction — 25,031 of 71,276 commercial and industrial accounts.Harris Central Appraisal District 2026 roll, files dated 13 Sep 2026, counted 20 Sep 2026.
- $86.1 billion of commercial appraised value in Harris County is taxed by no city — 39.9% of the county’s $216.0bn commercial roll.Harris Central Appraisal District 2026 roll, counted 20 Sep 2026.
- The City of Houston taxes barely half the commercial property in its own county — 35,807 of 71,276 accounts (50.2%) and $105.1bn of $216.0bn in value (48.7%).Harris Central Appraisal District 2026 roll, counted 20 Sep 2026.
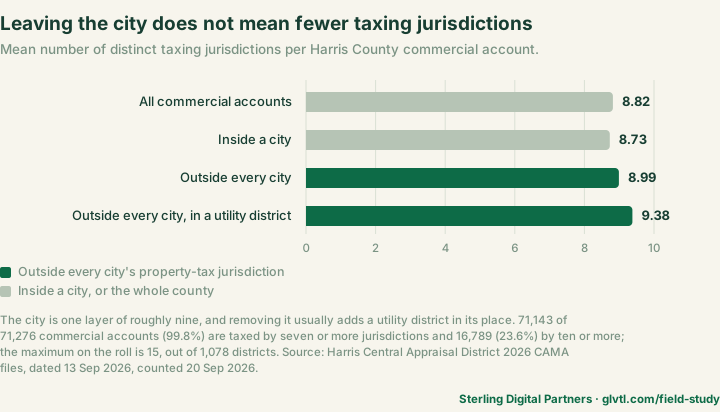
- The average Harris County commercial property is taxed by 8.82 separate jurisdictions; the most-taxed is taxed by 15, out of 1,078 taxing districts on the roll.Harris Central Appraisal District 2026 roll, counted 20 Sep 2026.
- 99.8% of Harris County commercial accounts are taxed by seven or more jurisdictions — 71,143 of 71,276 — and 23.6% (16,789) by ten or more.Harris Central Appraisal District 2026 roll, counted 20 Sep 2026.
- Commercial property outside every city is taxed by more jurisdictions, not fewer: a mean of 8.99 against 8.73 inside a city, and 9.38 outside a city and inside a utility district.Harris Central Appraisal District 2026 roll, counted 20 Sep 2026.
- 398 utility districts hold commercial property that no city taxes — 12,665 accounts (17.8%) on a narrow definition of a utility district, 13,222 (18.6%) on a broad one.Harris Central Appraisal District 2026 roll, counted 20 Sep 2026.
- 12,366 Harris County commercial accounts (17.3%) are taxed by neither a city nor a utility district — county-level districts, a school district and emergency services districts alone.Harris Central Appraisal District 2026 roll, counted 20 Sep 2026.
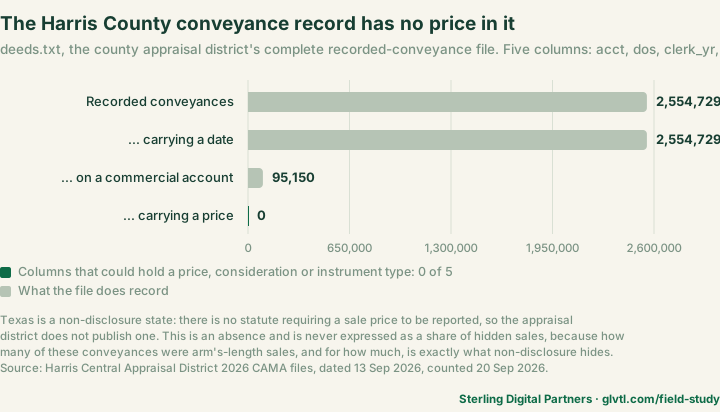
- The Harris County appraisal district’s complete conveyance file holds 2,554,729 recorded conveyances in five columns, and none of the five is a price.Harris Central Appraisal District
deeds.txt, file dated 13 Sep 2026, counted 20 Sep 2026. - Across seven Texas appraisal districts covering roughly twelve million people, exactly one publishes commercial sale prices — and it published 259 of them.Tarrant Appraisal District ratio-study files (165 improved, 94 land), against a 2,286,533-account roll; checked by hand 20 Sep 2026, not produced by this study’s script.
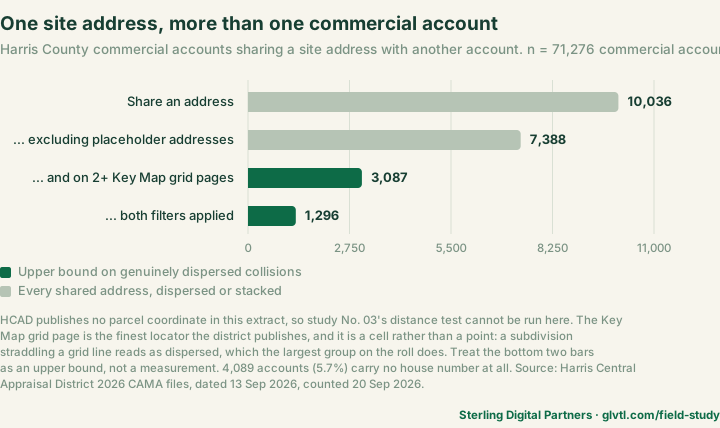
- 14.1% of Harris County commercial accounts share a site address with another account — 10,036 of 71,276, or 10.4% once the district’s placeholder addresses are excluded.Harris Central Appraisal District 2026 roll, counted 20 Sep 2026.
- The Harris County appraisal district publishes an annexation-year column and it is empty on all 71,276 commercial accounts —
yr_annexed, populated on 0.0% of them.Harris Central Appraisal District 2026 roll, counted 20 Sep 2026. - There is no citable snapshot of the Harris County roll: the district’s 2023, 2024, 2025 and 2026 archives were all rebuilt on 13 September 2026.
Last-Modifiedheaders read atdownload.hcad.orgon 20 Sep 2026; not produced by this study’s script.
Finding 01 / Jurisdiction
A third of the county’s commercial property is taxed by no city at all.
What share of Harris County’s commercial property is outside every city’s property-tax jurisdiction?
35.1% — 25,031 of 71,276 commercial and industrial accounts. The roll records, for every account, the list of taxing jurisdictions that actually levy on it. On 25,031 of them not one entry in that list is a municipality. The split is exact: 25,031 outside plus 46,245 inside is 71,276, the whole commercial roll. Those 25,031 accounts carry $86,073,628,876 of appraised value — 39.9% of the county’s $215,965,476,446 commercial roll. From here on we round those to $86.1bn and $216.0bn.
The City of Houston is the fourth-largest city in the United States and it taxes 35,807 of the commercial accounts in its own county — 50.2% — and $105.1bn of the value, 48.7%. Barely half, on both measures. The next five municipalities are not close: Pasadena holds 2,733 commercial accounts, Baytown 1,727, South Houston 864, La Porte 814 and Humble 780. Of the county’s 34 named municipal codes, 31 hold any commercial property at all.
What is there instead is districts. 398 utility districts — municipal utility districts, water control and improvement districts, utility and public utility districts — hold commercial property that no city taxes, covering 12,665 accounts, 17.8% of the commercial roll and $38.0bn, 44.1% of the value outside every city. Another 12,366 accounts, 17.3%, are in no city and no utility district either. Across the whole commercial roll the mean is 8.82 distinct taxing jurisdictions per account, the maximum is 15, and 748 of the county’s 1,078 taxing districts appear on at least one commercial account.
Read “Houston” as the government of a Houston commercial property and one time in three there is no city in the answer — and on the other two, half the time, the city is not Houston.
Can a commercial property be outside every city’s property-tax jurisdiction and still be inside the City of Houston?
Yes, and for a material share of these accounts it is. This is the strongest objection to the finding above, so it gets its own section rather than a footnote. Under Tex. Loc. Gov’t Code §43.0751, a city may annex an area for limited purposes through a strategic partnership agreement with a water district. The City of Houston’s own planning department describes the mechanism and adds the sentence that matters here: “The annexation typically includes commercial property only.” A limited-purpose annexation levies no ad valorem tax. It puts the property inside the city for sales tax and for regulatory reach, and leaves it outside the city for property tax — so it does not appear on the appraisal roll at all.
We found this the hard way. The first four properties picked to illustrate this study were clean on the roll — commercial, in a municipal utility district, no city among their taxing jurisdictions — and all four turned out to sit inside a City of Houston limited-purpose annexation, each ordinance naming the MUD in its own text. Houston Premium Outlets at 29300 Northwest Fwy (ordinance 2007-0363, HC MUD 358), Vintage Park at 142 Vintage Park Blvd (2007-0373, HC MUD 468), the Lowe’s at 7355 FM 1960 Rd E (2005-0271, HC MUD 132) and North Cypress Medical Center at 21214 Northwest Fwy (2010-0952, HC MUD 248, first amendment). All four were read off the city’s own GIS server, and in its 2000s and 2010s annexation layers alone there are 766 polygons naming a MUD.
So the claim this page makes is the one the roll supports: these 25,031 accounts lie outside every city’s property-tax jurisdiction. It does not claim they are governed by no city, and neither should anyone quoting it. Harris County regulates platting, drainage, floodplain and fire; a utility district supplies water, sewer and drainage; an emergency services district supplies fire and EMS; the Sheriff and the constable precincts police it. The honest phrase is no municipal property tax, not no government.
Does “no city” mean the property is in Houston’s extraterritorial jurisdiction?
No, and this study publishes no ETJ figure of any kind. The column we read lists taxing jurisdictions; an extraterritorial jurisdiction levies no tax, so it can never appear in that column. Our classification therefore sees city limits exactly and sees ETJ not at all. The statute-by-statute version of that limit is set out in the method section below, because it is the single easiest way to misread this page. An ETJ is not nothing, either: a commercial site in Houston’s five-mile band goes through a City of Houston plan review for plumbing, utility connection and setbacks under the permitting centre’s own form CE-1041, for an $88.69 minimum fee. What Houston cannot do there is regulate what you build or what you use it for.
A worked example: Grand Parkway Marketplace, HCAD account 1378500010001. A 156,885 sq ft community shopping centre at 6955 N Grand Pkwy, Spring, built in 2016 on 26.2 acres, appraised at $59,854,271 for 2026. Its taxing jurisdictions, read off the district’s own account page rather than from the bulk roll, number eleven, and not one of them is a city: Klein ISD, Harris County, Harris County Flood Control, the Port of Houston Authority, the Harris County Hospital District, the Harris County Department of Education, Lone Star College System, Dowdell Public Utility District, Dowdell PUD (DA) — the same district taxing the same parcel a second time under a separate defined-area code — and Harris County Emergency Services Districts 7 and 11. Total $2.9249 per $100 of valuation at 2025 adopted rates.
It survives the limited-purpose screen: the City of Houston’s annexation layers return nothing at twelve points inside the parcel polygon, full or limited purpose; the Census Bureau’s incorporated-places layer returns no place; the county’s city-limits layer returns UNINCORPORATED.
It is also not typical, and the page should say so. The median appraised value across all 25,031 accounts outside every city is $841,293. Grand Parkway Marketplace is seventy times that. The largest accounts on this part of the roll are, in any case, not buildings: the highest-valued are “IMPS ONLY” shells in the Ship Channel petrochemical corridor, where improvements sit on one account and the land on another so an abatement can be carved out, and they carry a building area of zero. Any “largest property” claim built on those is false.
Account, values, land use and all eleven jurisdiction lines read at search.hcad.org on 20 September 2026. Parcel geometry from the Harris County Parcels feature service; annexation from the City of Houston Planning & Development PDD/Annexation_History service; places from Census TIGERweb. The $841,293 median was recomputed from the same 2026 roll during example verification; it is not one of the 60 figures in the counts CSV.
Check it yourself
The answer is a column. In real_acct.txt, jurs is a space-separated list of taxing-district codes for the account; jur_tax_dist_exempt_value_rate.txt turns each code into a name and a rate. Read that list before you read the address, and read it by code, not by name. Harris County has districts called CHELFORD CITY MUD, CLEAR BROOK CITY MUD and CLEAR LAKE CITY WA, plus fifteen tax-increment zones with the word CITY in their names, and not one of them is a city. A name match would have shipped every one of them as a municipality.
Two counts of two different things. The Texas Commission on Environmental Quality’s own district register lists 460 active municipal utility districts in Harris County (dataset hr84-s96f, counted 20 September 2026). Our 398 is a count of utility districts that appear on a commercial account outside every city, on the appraisal roll. A register of districts and a roll of properties are different measurements, and the two numbers should never be subtracted from one another.
Finding 02 / The tax bill
Leaving the city does not mean fewer taxing jurisdictions. It means more.
How many taxing jurisdictions does a Houston commercial property pay?
8.82 on average, seven or more in 99.8% of cases, and fifteen at the maximum. Ask a search engine that question today and it tells you the number varies and to go look up your own address. It does vary — across 1,078 districts — but it has a shape, and the shape is not the one the obvious reading of finding 01 predicts.
The obvious reading is that a property nobody municipal taxes has a simpler tax bill. It does not. Commercial accounts inside a city average 8.73 taxing jurisdictions. Accounts outside every city average 8.99. Accounts outside every city and inside a utility district average 9.38. The city is one layer of roughly nine, and removing it does not remove the other eight; a utility district is usually added in its place, and in the worked example above that district taxes the parcel twice, under two codes.
There is no long tail of lightly-taxed commercial property in this county. 71,143 of 71,276 accounts — 99.8% — are taxed by seven or more separate jurisdictions, and 16,789, or 23.6%, by ten or more. Two accounts on the roll are taxed by fifteen.
The margin here is narrow — 8.99 against 8.73 — and it points the opposite way to intuition. That is the finding: the unincorporated third of this market is not the lightly-governed part of it.
Check it yourself
Count the codes in jurs for the account, then price them. A rate you have not added is a rate you are not underwriting: in the worked example the utility district and its defined area together levy $1.04 per $100, more than Harris County, the flood control district, the port authority, the hospital district, the department of education and the college system combined.
Do not assume the mean applies to your property. It is a mean over 71,276 accounts with a maximum of 15, and the difference between eight jurisdictions and eleven is real money on a real building.
Finding 03 / Comparable sales
2,554,729 recorded conveyances, five columns, and not one of them a price.
Does the Harris County record show what a commercial property sold for?
No. There is no price column anywhere in the file. deeds.txt, the appraisal district’s complete recorded-conveyance file, holds 2,554,729 rows and five fields: the account number, the date of sale, the county clerk’s year, the clerk’s file number and a deed identifier. That is the whole record of who conveyed what to whom in the third-largest county in the United States. 95,150 of those rows sit on commercial accounts, covering 49,225 accounts — 69.1% of the commercial roll, with dates running from 1899 to 2025. Every one of them carries a date and none of them carries an amount. Elsewhere in the roll, new_own_dt is populated on 71,261 commercial accounts, 100.0% — another bare date with no companion figure.
This is a consequence of statute, not of the district. Texas is a non-disclosure state: no law requires a buyer or seller to report what was paid, so the appraisal district has nothing to publish. And it is not a Harris County peculiarity. Across seven Texas appraisal districts covering roughly twelve million people, exactly one publishes commercial sale prices — and it published 259 of them: 165 improved and 94 land, in Tarrant County’s ratio-study files, against a roll of 2,286,533 accounts.
How to read this figure, and how not to. This is an absence, and it is never a share. We do not publish a percentage of sales with no price, because the denominator — how many of these 2,554,729 conveyances were arm’s-length sales, and for how much — is precisely what non-disclosure hides. Study No. 03 could report that 73.9% of Mecklenburg County’s commercial sales carry a disqualification code because North Carolina publishes both the prices and the codes. Texas publishes neither, so the only honest construction is the one in the heading: 2,554,729 conveyances, five columns, none of them a price.
Every commercial comparable in this county comes from somewhere other than the public record. If you cannot name where yours came from, you do not have one.
Check it yourself
Open the header row of deeds.txt before you build anything on it: acct | dos | clerk_yr | clerk_id | deed_id. If a data product hands you a Texas commercial sale price, ask which of those five fields it came from. The answer is that it came from somewhere else — a broker, a CoStar-class subscription, a lender, a tenant — and the provenance is the thing to interrogate, not the number.
The 259 figure above and the seven-district comparison were checked by hand against those districts’ published ratio-study files on 20 September 2026. They are not produced by count_harris.py, which reads only Harris County, and nothing in the “reproduce it” section below covers them.
Finding 04 / Property match
One site address, several commercial accounts — and no way to measure how far apart.
How often do two Harris County commercial accounts carry the same address?
14.1% of the time — 10,036 of 71,276 accounts. Across 64,713 distinct commercial site addresses, 3,473 (5.4%) are written on more than one account. Some of that is the district’s own placeholder: 4,089 commercial accounts, 5.7%, have no house number at all, their site address beginning 0. Strip those out and 2,844 addresses are still shared, across 7,388 accounts — 10.4%.
These are published as an upper bound, and here is why. Study No. 03 measured this properly in Mecklenburg County: the county publishes a coordinate for every parcel, so we measured the distance between them, and a stacked condominium has a spread of zero. The Harris County appraisal district publishes no coordinate in this extract, so that test cannot be run. The finest locator it does publish is key_map, the Key Map grid-page reference, which is missing on only 184 of the 71,276 commercial accounts. On that substitute, 739 of the 3,473 shared addresses span more than one grid page, covering 3,087 accounts (4.3%), or 1,296 (1.8%) with placeholders excluded.
What the method cannot distinguish. A Key Map page is a cell, not a point. A subdivision that straddles a grid line reads as dispersed even though every lot in it is adjacent, and two properties genuinely a few hundred feet apart inside one cell read as stacked. We can prove the first half against our own data: the largest shared address on the roll, 2720 MASSEY TOMPKINS RD 1 with 112 accounts, spans two grid pages — and it is one consecutive block of account numbers in a single neighbourhood code, on 0.13 to 0.17 acre lots, with 104 of the 112 carrying zero building area. It is a platted small-lot subdivision, not 112 commercial buildings, and the grid test counts it as dispersed anyway. So 4.3% is a ceiling on genuine dispersion, not a measurement of it, and this study does not claim study No. 03’s result.
A returned record is not a match. In this county you cannot even measure how badly it might not be one.
Check it yourself
Confirm the account number, not the address. If a search returns more than one commercial account on a Harris County address, open the land and building detail on each before you choose: the largest groups on this roll are vacant platted lots and identical small units, and they look like buildings only from the address column.
What we changed from earlier studies. Addresses here are compared exactly as the district wrote them, uppercased with runs of whitespace collapsed and nothing else altered. No directional prefix is stripped and no abbreviation expanded. Study No. 02 built this finding on directional-prefix matching and four of its headline examples turned out to be condominium wing labels; that method is not used here, and the distance test that replaced it in study No. 03 is not available in this county.
Finding 05 / The record itself
The archive is not an archive, and the annexation column is empty.
Can anyone reproduce a historical analysis of the Harris County roll?
Not from the appraisal district. HCAD publishes its bulk data by tax year, at /data/CAMA/2023/, /2024/, /2025/ and /2026/. Read the Last-Modified header on those directories’ files and all four were written on 13 September 2026. The file labelled 2023 was created last week. They are not frozen historical files; they are current re-exports of historical tax years, and they change when the district re-exports them. Dallas County’s appraisal district publishes DCAD2026_CERTIFIED_07232026.zip, a file whose name carries its own certification date. Harris publishes no equivalent.
The state route is closed too. Appraisal districts submit their rolls to the Texas Comptroller through the Electronic Appraisal Roll Submission process, which goes to a secure FTP site rather than a public one, and what the Comptroller publishes from it is biennial aggregate studies — not the parcel-level roll as of a date. So there is no public, dated, citable snapshot of the Harris County appraisal roll from either the district or the state.
That is a finding about the record, not a complaint about it, and it is why the reproducibility promise on this page is phrased the way it is: a later file will not reproduce these figures exactly. What reproduces is the method. The counts, the script and the full district classification are all published here so that the arithmetic can be re-run against whatever file the district is serving on the day you read this.
Does the roll say when a property was annexed?
It has a column for it, and the column is empty. real_acct.txt carries 71 fields, one of which is yr_annexed. It is populated on 0 of 71,276 commercial accounts — 0.0%. On a roll where a third of commercial property has never been annexed by anybody, the field that would record annexation is blank on every single commercial account, whether it was annexed or not. Anyone hoping to reconstruct the history of this county’s city limits from the appraisal roll is reading an empty column.
The counts on this page are dated, and they have to be. Nothing in the source is.
Check it yourself
One command, no download: curl -sI https://download.hcad.org/data/CAMA/2024/Real_acct_owner.zip and read the Last-Modified line. Compare it against the same header on the /2026/ path. If you are citing a Harris County figure, cite the date you counted it and say which file you counted, because the file name will not tell your reader anything.
One quirk worth knowing before you script it: the directory index at https://download.hcad.org/data/CAMA/2026/ returns HTTP 500, while every file at that path returns 200. Address the files directly, as our script does.
When you do this weekly
Five checks, every property, before you say a number out loud.
All five are catchable by hand, and Harris County makes it easier than most: the whole roll is a free anonymous download, with no login, no fee, no request form and no API key. It still takes time you may not have on every address — and in this county it takes a jurisdiction list, not just a parcel.
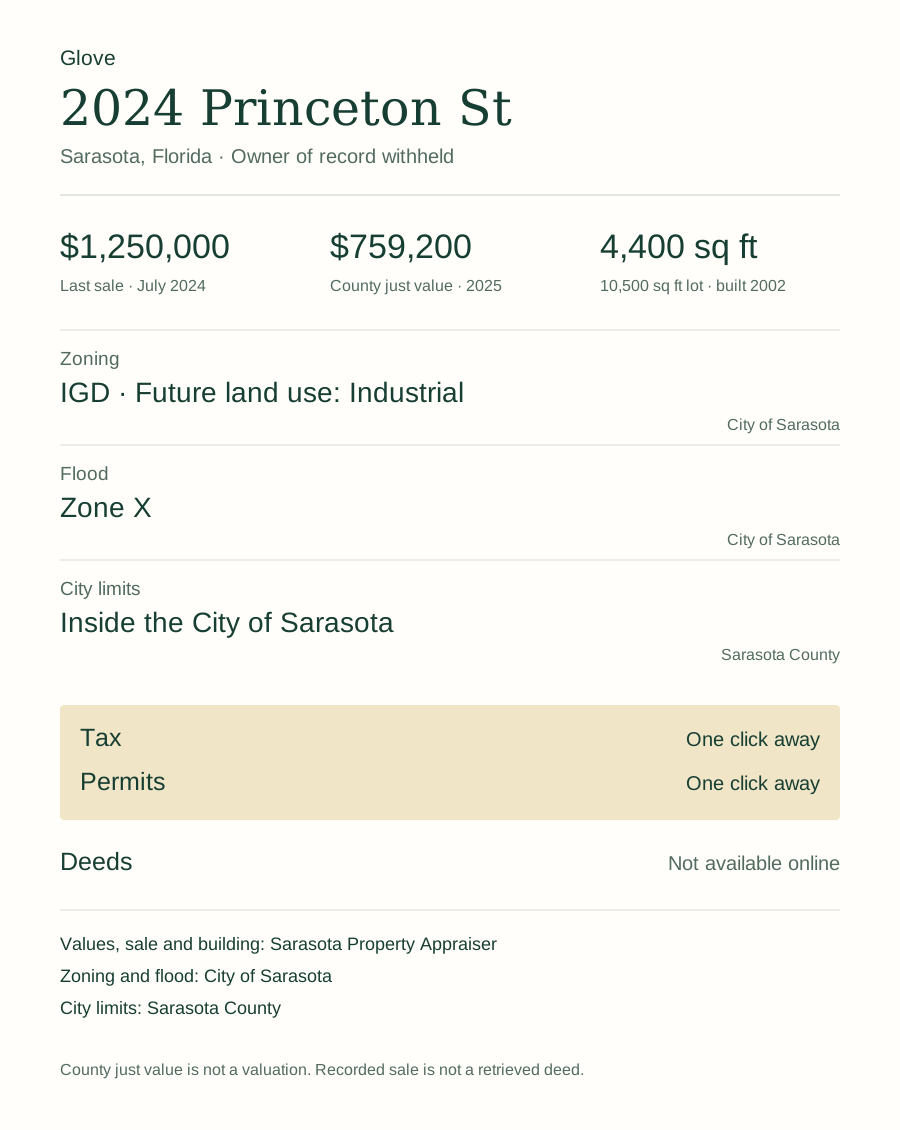
Glove does the same digging in one call, inside Claude Code, Cursor or Codex — parcel, the value type the district reports with its year, last sale, zoning, flood and city limits, each number carrying the page it came from. Recorded documents and permits are still yours to click.
Five free packets. Each successful packet uses one credit.
Works in Claude Code, Cursor and Codex.
Method, and what these counts do not establish
Source
Two files, both published by the Harris Central Appraisal District, both free, and both a direct anonymous download — no login, no fee, no request form, no CAPTCHA and no API key. Real_acct_owner.zip (211,881,907 bytes, last modified 13 September 2026 at 21:23 GMT), for the members real_acct.txt and deeds.txt; and Real_jur_exempt.zip (114,185,783 bytes, last modified 13 September 2026 at 21:24 GMT), for jur_tax_dist_exempt_value_rate.txt. Both were downloaded and counted on 20 September 2026. Unlike study No. 03’s county, this server answered the default Python user-agent with a 200 on every request, so no workaround is needed; the directory index at that path, however, returns HTTP 500 while the files themselves return 200.
Every figure above is recomputed by count_harris.py, standard library only, no install step. python3 count_harris.py downloads both files and counts them; pass paths to count copies you already have; --csv writes the counts file, --districts prints the full code-to-class table. The four charts are drawn by make-charts.py, which reads its values out of the counts CSV rather than carrying any of its own.
Definitions
- Commercial — Texas state class
F1(real, commercial) orF2(real, industrial), as printed instate_class. 68,811 plus 2,465, or 71,276 of the roll’s 1,628,306 accounts. Multi-family is excluded, as in studies No. 01, No. 02 and No. 03. - Account — a distinct
acct. It is unique acrossreal_acct.txt: 1,628,306 rows, 1,628,306 distinct values, verified before it was used as a join key. - Value —
tot_appr_val, total appraised value, throughout. The file offers four candidate value columns that disagree with one another — appraised, assessed, total market, and land plus building — and choosing a different one moves every value figure on this page. - In a city — our classification, not the district’s. HCAD publishes no district-type column. A city is a taxing district in the contiguous code block
051–086, less069, which the district names literallyNOT USED;077is absent from the table altogether. That leaves 34 named municipalities. Classification is by code, never by name. - A utility district — a name match, and the weaker half of the classification, so it is published as two numbers. Narrow (
MUD,WCID,UD,PUD,WC&ID) gives 651 districts and 12,665 accounts; broad (adding fresh water supply districts, water authorities and drainage districts) gives 668 districts and 13,222. The gap between the two is the width of the judgement call. Every one of the 1,078 districts, its name and the class we gave it is published in the district CSV so you can disagree with it line by line. - A shared address — two or more accounts on the same
site_addr_1, uppercased with runs of whitespace collapsed and nothing else changed.
“No city” is not “in the ETJ,” and the roll cannot tell you which
Texas law separates a city’s extraterritorial jurisdiction from its taxing authority. An ETJ is the unincorporated buffer around a municipality — five miles for a city over 100,000 people (Tex. Loc. Gov’t Code §42.021(a)(5)) — in which the city may extend subdivision-platting rules but is expressly forbidden to regulate “the use of any building or property for business, industrial, residential, or other purposes” (§212.003(a)). ETJ status carries no power to tax. The Tax Code defines a “taxing unit” as an entity “authorized to impose and is imposing ad valorem taxes on property” (§1.04(12)), and a city has no such authority outside its corporate limits. An appraisal district appraises property “for ad valorem tax purposes of each taxing unit that imposes ad valorem taxes on property in the district” (§6.01(b)), and each appraisal record must identify “each taxing unit in which the property is taxable” (§25.02(a)(11)). Because a city never levies a tax in its ETJ, the city never appears on that parcel’s taxing-unit list. Our classification reads the taxing jurisdictions on the roll. It therefore sees city limits exactly, and sees ETJ not at all. We publish no ETJ count, and any figure claiming one from an appraisal roll is not reproducible.
The district’s own documentation agrees about what the field is. HCAD’s GIS PData Dictionary defines the Code field on its City layer as a four-character code representing “a taxing jurisdiction maintained by HCAD” — 061 = CITY OF HOUSTON — and there is no ETJ entry anywhere in that taxing-jurisdiction schema. HCAD does publish a separate cartographic city-limits and ETJ boundary layer; that is a map, not a tax record, and it is not the field this study reads.
What this is not
- “Outside every city’s property-tax jurisdiction” is not “governed by no city.” A limited-purpose annexation under Tex. Loc. Gov’t Code §43.0751 puts a commercial property inside a city for sales tax and regulatory reach while levying no ad valorem tax, so it leaves no trace on this roll. Finding 01 sets out four verified examples and the 766 annexation polygons naming a municipal utility district in the City of Houston’s 2000s and 2010s layers alone.
- It is not “governed by nobody” either. Texas counties have no zoning power — Chapter 211 grants it to municipalities, and Harris County is not among the counties named in Chapter 231 — but the county regulates platting, drainage and floodplain development, reviews commercial life safety through the Fire Marshal’s code, and enforces both in court. Water, sewer and drainage come from a district. Fire and EMS come from an emergency services district. The Sheriff and eight constable precincts police it.
- Private covenants are invisible here too. Houston has no zoning ordinance of its own and leans on deed restrictions, which a municipality may enforce by injunction under §212.153. A tract outside every city may be tightly restricted by covenant and show nothing on the roll. A claim about governance built on an appraisal roll can no more see a covenant than it can see an ETJ.
- The city and utility-district classifications are ours. The district publishes no district-type column. The city half is a code block and is as solid as the roll; the utility half is a name match and is published as a range for that reason.
- The address finding is an upper bound. Without coordinates the grid-page test over-counts dispersion, demonstrably so on the largest group on the roll. It is not study No. 03’s distance measurement and is not comparable to it.
- The absence of price is an absence, never a share. No figure on this page expresses unpriced conveyances as a percentage of sales, because the denominator is exactly what non-disclosure hides.
- These are counts of files dated 13 September 2026, from a publisher that issues no certified or dated snapshot and rebuilds its prior-year directories. A later file will not reproduce these numbers exactly. What should reproduce is the method.
- We publish no protest or appeal outcome figures. The script computes them and prints them under an explicit not-a-published-finding banner; they are not in the CSV and they are not on this page.
- No municipal utility district tax rate range appears here. The only one we found came from a tax-protest firm’s blog and we could not verify it against adopted-rate notices.
- This is one observation of one county on one date, not a promise about every search you will run.
- Nothing here is a survey, a valuation, a title search, a zoning determination or a permission for a proposed use.
- Aggregate counts only. No owner name, mailing address, grantor, grantee or legal description is read or reproduced;
owners.txtis never opened, and the script drops those columns before it reads a row.
Reproduce it
The counts are published as a CSV — 60 figures, each with its denominator, its share and a note on how it was derived, under a commented header naming every source and file date. All 1,078 taxing districts are published with the class we assigned each one, so the judgement call in the definitions above can be audited rather than taken on trust. Both source files are a plain HTTP download, so every Harris County figure on this page can be recomputed from scratch on a laptop with nothing installed. The two figures that count_harris.py does not produce — the seven-district price comparison in finding 03, and the archive rebuild dates in finding 05 — are attributed where they appear and can be checked with a browser and curl respectively.
Cite this study
Klebl, C. (2026). A third of Houston’s commercial property is taxed by no city. Sterling Digital Partners. Retrieved from https://glvtl.com/field-study/harris-commercial-record/
Link to it
<a href="https://glvtl.com/field-study/harris-commercial-record/">A third of Houston’s commercial property is taxed by no city</a>, Chris Klebl, Sterling Digital Partners, 2026.
Corrections
If a count looks wrong, tell us with the metric name and the public source. We will re-run it and re-date the page.
Looking up a Harris, Fort Bend or Montgomery County record yourself? The Houston records directory lists every official source we have checked there, with the date a person opened it and what trips people up.
The series
This is the fourth of ten, and the first in Texas. Study No. 01 counts Sarasota and Manatee; study No. 02 counts Miami-Dade; study No. 03 counts Mecklenburg County, North Carolina. The rest are listed on the field studies index, where you can ask to be told when your market lands.